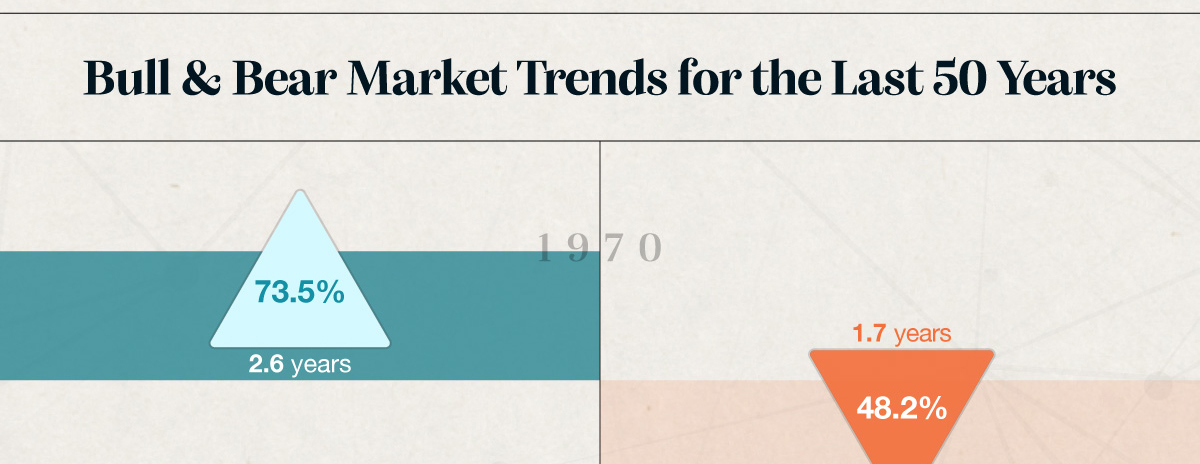
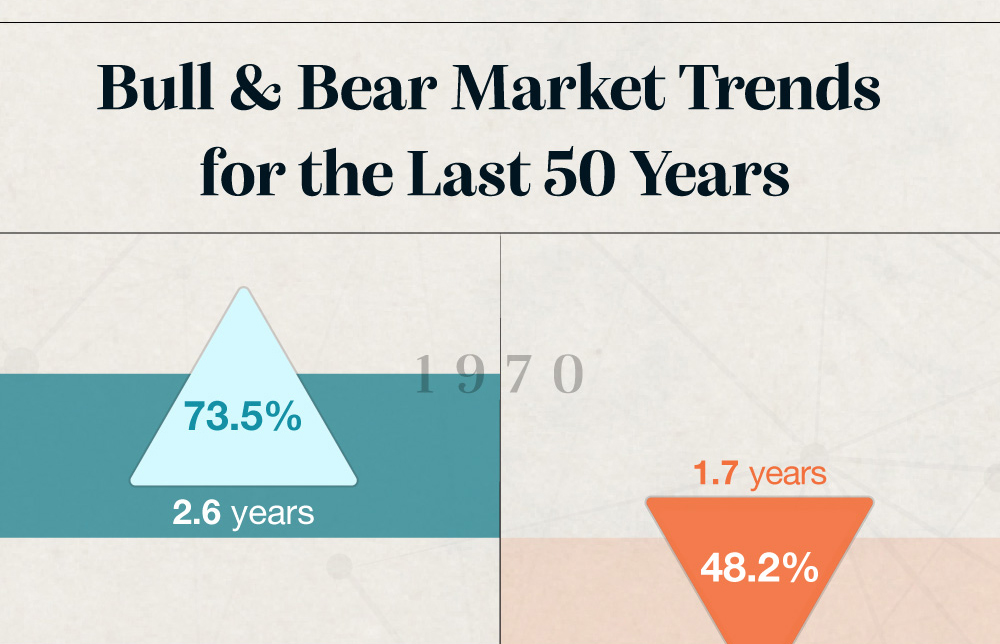
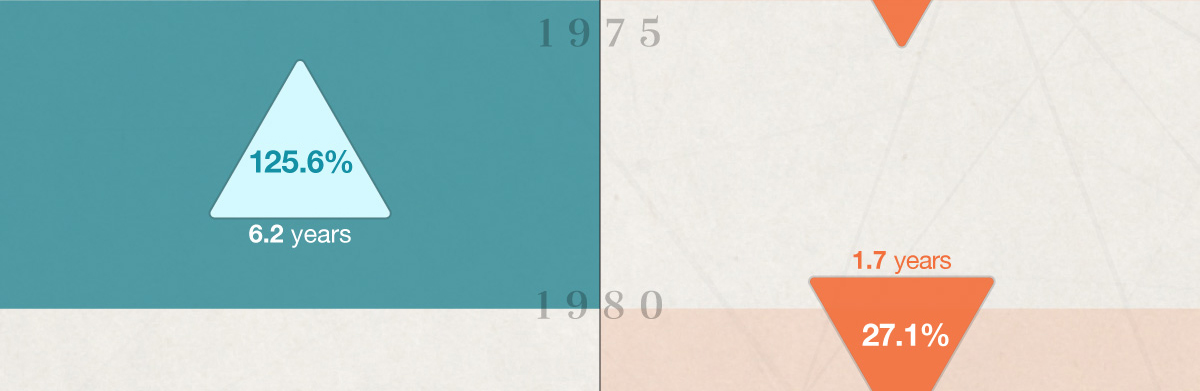
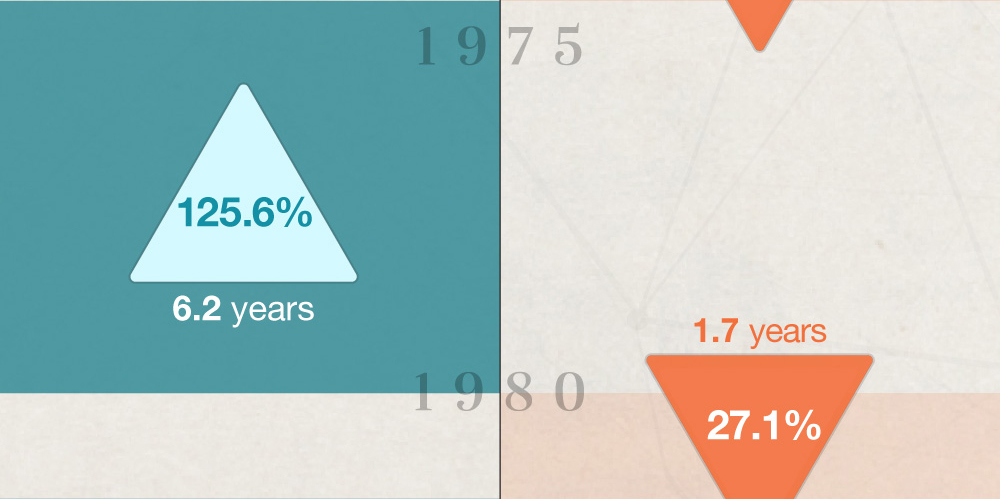
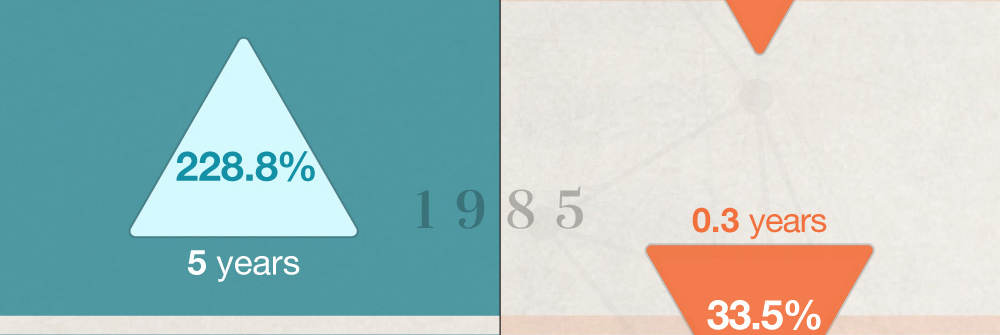
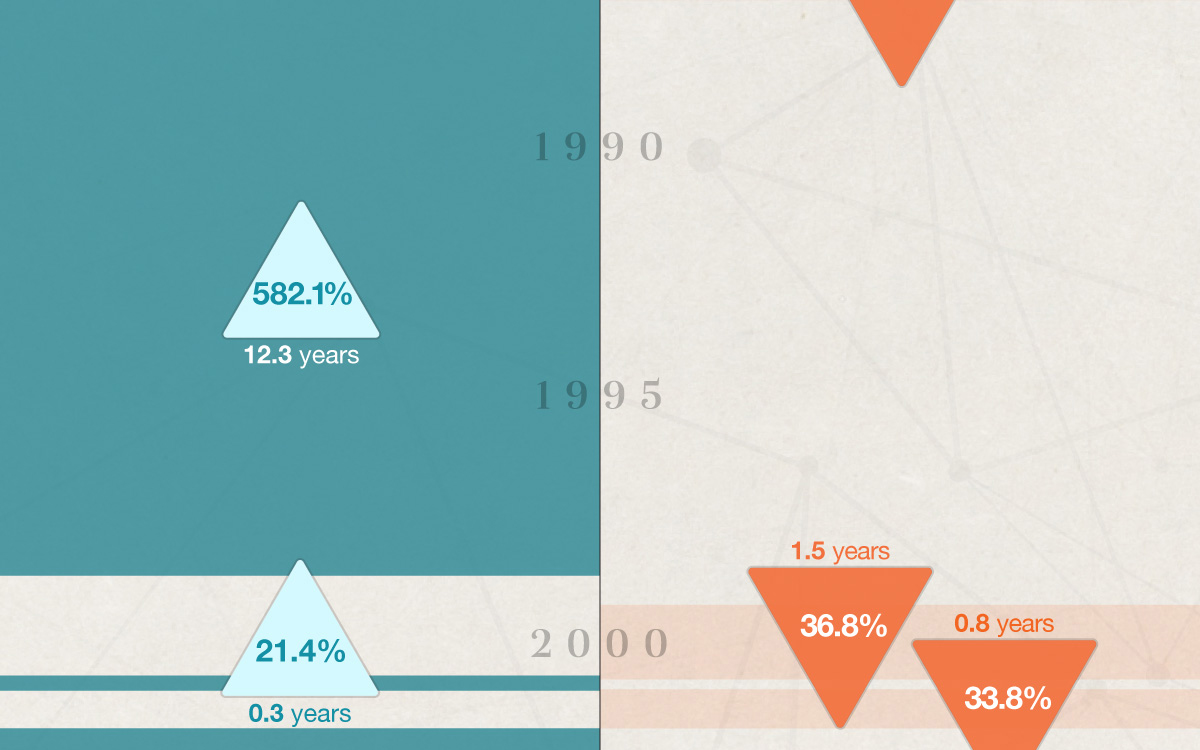
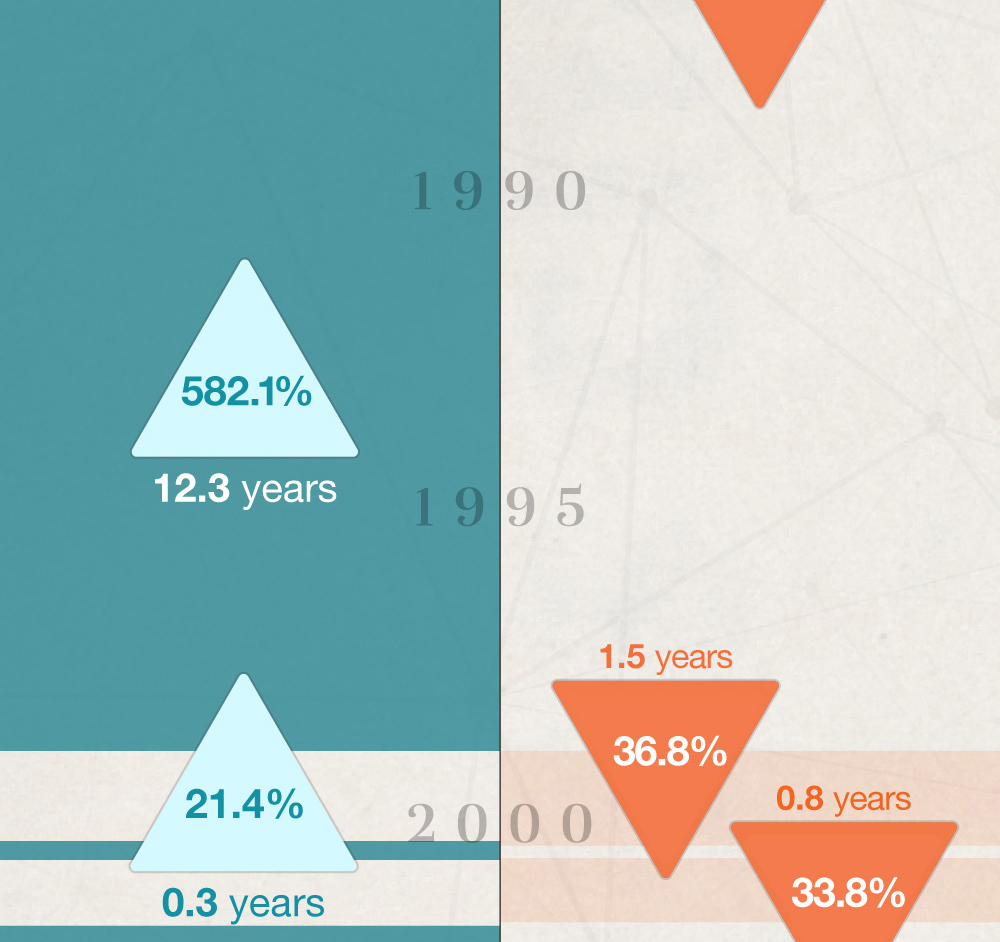
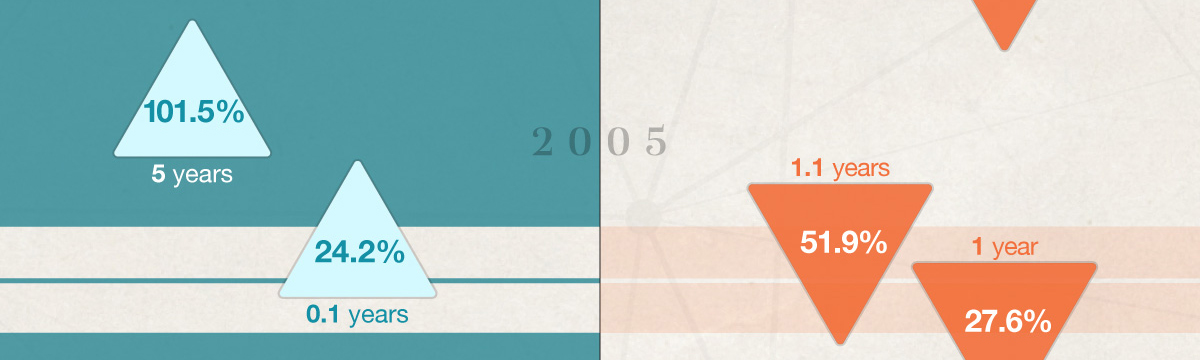
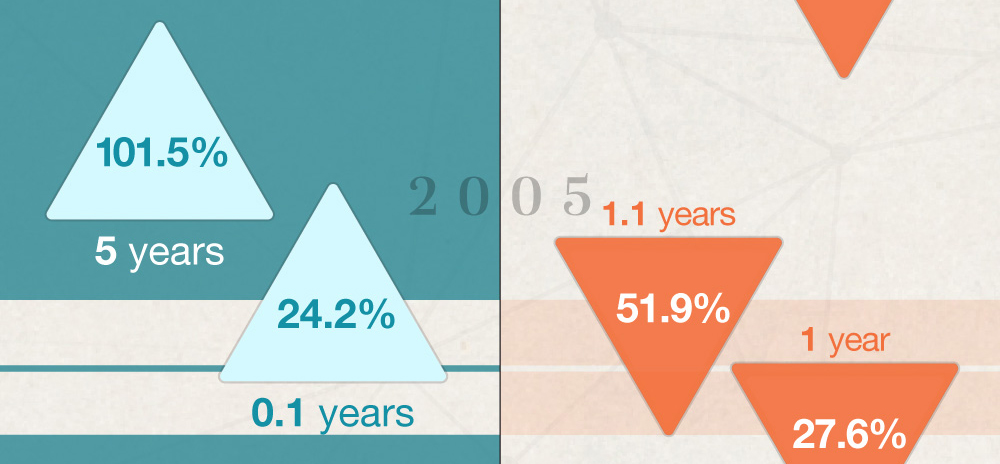
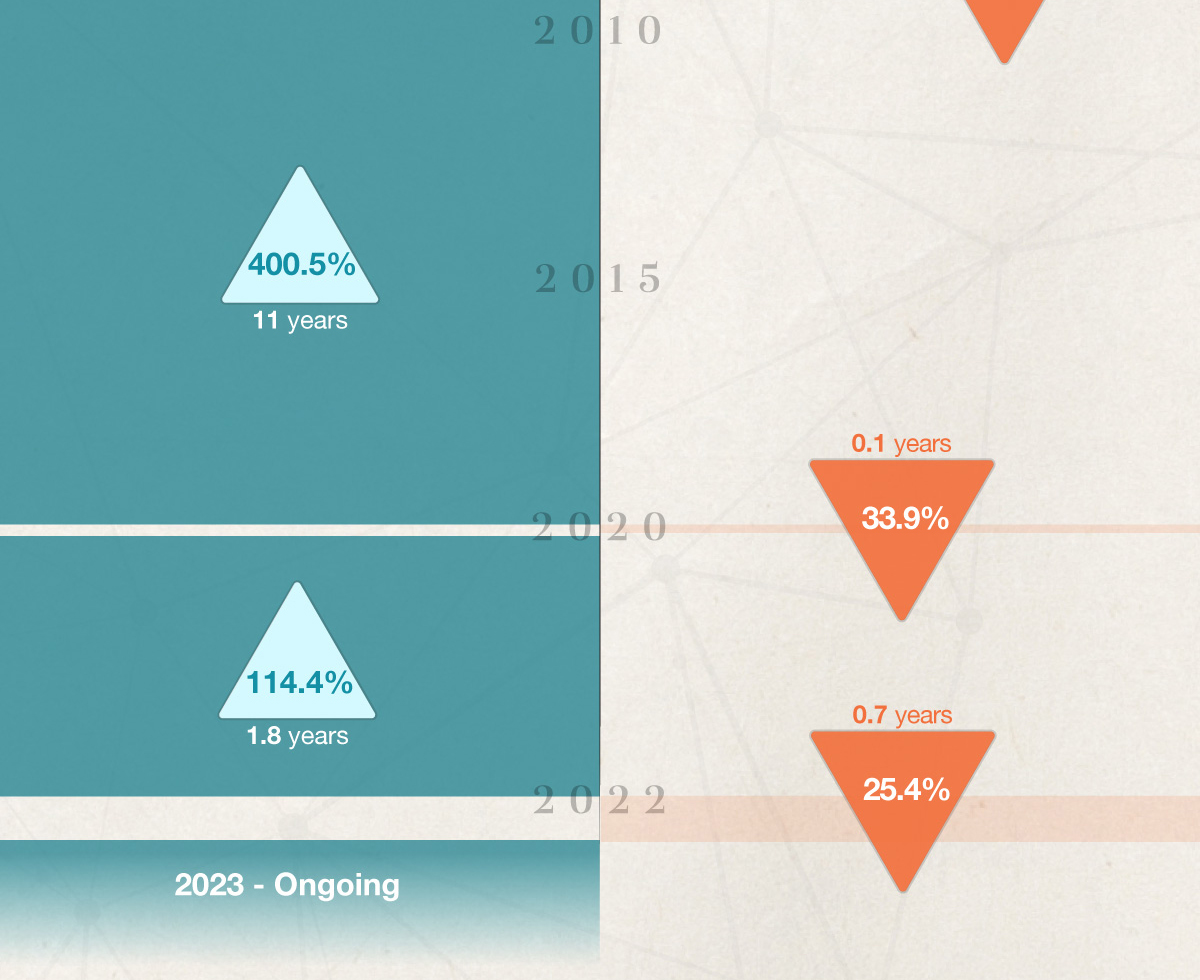
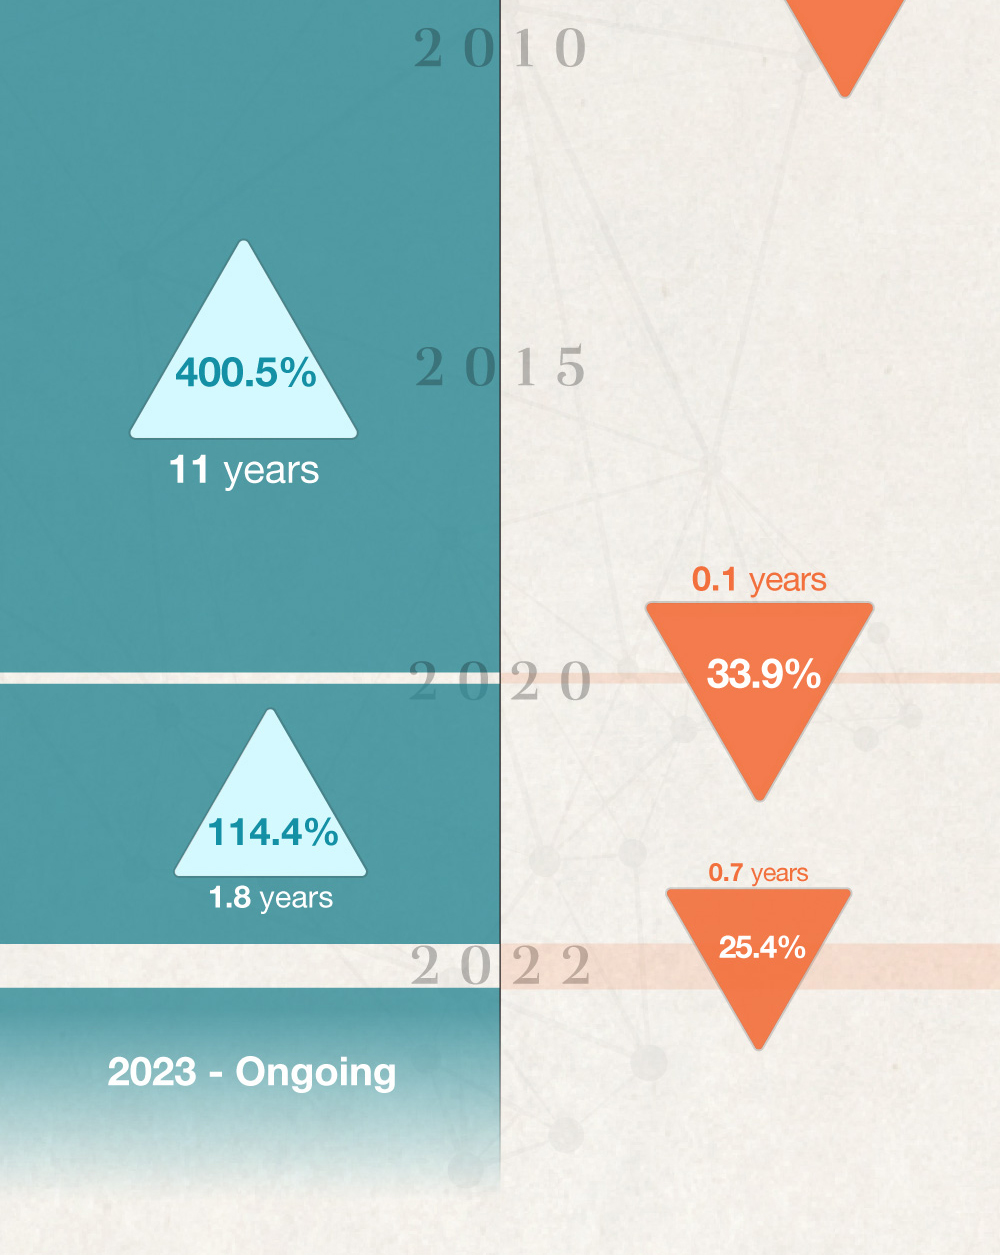
Bull & Bear Markets: A Timeline


65 or older? It may be time to enroll in Medicare. Read to learn if you’re eligible.
In this article, explore the benefits of the Federal Student Grant Program.
Want to do more with your wealth? You might want to consider creating a charitable foundation.
As our nation ages, many Americans are turning their attention to caring for aging parents.
Retirement income may come from a variety of sources. Here's an overview of the six main sources.
Affluent investors face unique challenges when putting together an investment strategy. Make sure you keep these in mind.
How much is enough to retire? It depends on your lifestyle, timeline, and more. Use this calculator to get a personalized est
Compare your current student loan terms to a potential refinance to see if it makes sense.
Work backwards from your savings goal to find the rate of return you'd need to get there.
Pundits say a lot of things about the markets. Let's see if you can keep up.
Understanding the cycle of investing may help you avoid easy pitfalls.
A bucket plan can help you be better prepared for a comfortable retirement.